
Truth about Used Oil Analysis
What is Analysis ?
Definition
Definition of analysis:
a•nal•y•sis [ənálləssiss]
- close examination:
the examination of something in detail in order to understand it better or draw conclusions from it - separation into components:
the separation of something into its constituents in order to find out what it contains, to examine individual parts, or to study the structure of the whole - assessment:
an assessment, description, or explanation of something, usually based on careful consideration or investigation
Synonyms:
examination, study, investigation, scrutiny, breakdown, inquiry, exploration,
evaluation, consideration, probe.
Analysis - just like the definition explains is, in case of
Used Oil Analysis, the examination of the Used Oil
Sample.
Nothing more, nothing less !
Used Oil Analysis - UOA
INTRODUCTION
For many years, lubricant inspection and testing has been used to help diagnose the internal condition of oil-wetted components and provide valuable information about lubricant serviceability.
The first test methods used for this purpose included such simple procedures as smelling used oil for the sour odor of excess acid, checking visually for obvious signs of contamination, or placing a drop of sample on absorbent paper to detect contaminants and monitor additive effectiveness.
As basic research and technology expanded, progress in lubricant testing kept pace.
An increasingly large number of tests were developed to assess lubricant physical properties and detect contaminants.
In 1946 the Denver and Rio Grande Railroad research laboratory successfully detected diesel engine problems through wear metal analysis of used oils.
A key factor in their success was the development of the spectrograph, a single instrument that replaced several wet chemical methods for detecting and measuring individual chemical elements such as iron or copper.
This practice was soon accepted and used extensively throughout the railroad industry.
By 1955 Oil Analysis had matured to the point that the United States Naval Bureau of Weapons began a major research program to adopt wear metal analysis for use in aircraft component failure prediction.
These studies formed the basis for a Joint Oil Analysis Program (JOAP) involving all branches of the U.S. Armed Forces.
The JOAP results proved conclusively that increases in component wear could be confirmed by detecting corresponding increases in the wear metal content of the sample lubricating oil.
In 1958 Pacific Intermountain Express (P.l.E.) was the first trucking company to set up an in-house used oil analysis laboratory to control vehicle maintenance costs.
This extensive history makes oil analysis the oldest of the proactive maintenance technologies.
In 1960 Analysts, Inc. was founded, becoming the first independent laboratory to provide a complete oil analysis diagnostic service to all areas of business and industry.
Modern-day oil analysis is built on the firm foundation of these early efforts.
The importance of using a combination of physical and spectrochemical tests to monitor lubricant and component condition is now universally accepted.
Oil analysis test procedures are established and reviewed by such agencies as the International Organization for Standardization (ISO), the American Society for Testing and Materials (ASTM) and the Society of Automotive Engineers (SAE), and a wide variety of laboratory and personnel certifications has emerged.
The basis of modern oil analysis is the use of optical emission spectroscopy (OES) to measure the ppm (parts per million) levels of wear metals, contaminants and additives in oil samples.
Whatever else an oil testing laboratory may measure, a multi-elemental analysis is the core of current in-service oil analysis.
The latest trend in dedicated oil analysis equipment is a steady progression of smaller, lighter, more versatile instruments.
Such new instruments are result of great advancement in electronics, computers and sensor technology and are usually less expensive, require less operator interference or sample preparation.
BASICS OF OIL ANALYSIS
Oil analysis is the most widely accepted and implemented form of proactive maintenance technology.
It is an integral part of the maintenance plan for power plants, manufacturing plants, trucking companies, construction equipment, aircraft, refrigeration systems, processing and chemical plants, etc.
Any piece of equipment that has a lubricating system is an excellent candidate for oil analysis.
A successful oil analysis program requires an organized and sustained effort. Both the user and the laboratory must work closely together to achieve the desired results.
Most important and often neglected or not addressed aspect of Oil Analysis is the COST versus BENEFIT.
Every sales pitch from every Oil Analysis Laboratory (and currently there are hundreds of them) makes you believe that sending them Used Oil Sample after EVERY Oil Change, will "change your life" !
The simple reality however is that it will cost you MONEY !
So the end customer's COST versus BENEFIT needs to be considered.
In major industrial application where specific equipment cost may be in millions of dollars and hundreds of gallons of lubricating oil are involved, the COST v. BENEFIT equation is quite different from single vehicle owner.
Car that has 4 Quart or Liter Motor Oil capacity, and simple oil change usually costs the same or less than typical Oil Analysis, the COST v. BENEFIT equation is no longer money issue, but something that is promoted as "peace of mind" in knowing that the engine may be OK.
Theory behind Oil Analysis
The lubricating oil may be thought of as a diagnostic medium because the oil carries with it the particles generated by the wear contact.
Abnormal wear modes such as corrosion, abrasion, severe wear, spalling, etc., cause an increase in the concentration of wear metals in the oil.
Contaminants are detected and lubricant mix-ups or badly degraded lubricants are identified by the concentration of additive elements.
Multi-element analysis, coupled with knowledge of the materials of construction, often allows identification of a specific component in distress or identifies additive depletion.
Basic Used Oil Analysis
There are many different types of Used Oil Analysis, each requiring different Instrument, specific Procedure for the Instrument operation, which the Operator must follow, Sample Preparation, obtaining a Result and finally the Result Interpretation by the Analyst.
Date from sequence of test is then used to establish a Trend, which is then further Interpreted by the Analyst.
Based on the Trend specific recommendations can be made by the Analyst.
The BASIC Used Oil Analysis is something that every vehicle owner or operator can perform personally, with just minimal training.
As unbelievable as it sounds, just looking at your engine's dipstick, is a form of Used Oil analysis.
We will discus this Dipstick Analysis - first - as that will give you more understanding and insight on the specific issues and problems with any type of UOA.

Example:
- Device
- Dipstick
- Analysis Type
- Visual
- Condition Observed
- Motor Oil Level
- Motor Oil Color
- Condition Observed
- Touch
- Condition Sensed
- Lubricity or "slipperiness"
- Large suspended wear particles
- Condition Sensed
- Smell
- Condition Sensed
- Motor Oil Odor
- Condition Sensed
- Visual
WOW !
Now when such a simple action as looking on a dipstick is presented in a "scientific test" way, suddenly such "Used Oil Analysis" sounds super sophisticated !
It is, however, an excellent way to illustrate the basic principles of all Types of Used Oil Analysis, their advantages as well as shortcomings.
Dipstick Used Oil Analysis
Instrument
Dipstick
Calibration
The Instrument = Dipstick must be properly Calibrated for the specific Engine to be of any use to obtain Result that has Value.
Again that may sound so obvious, but it is not always so !
On more than one occasion over the years even the OEM have installed the "wrong" dipstick on a specific Engine, that was not properly Calibrated.
At other times the Rubber or Plastic "stop" may come lose and move up or down on the dipstick, thus yielding a "false" reading.
Therefore, Validating that the Instrument is properly Calibrated is the first and most important step in any Analysis procedural sequence.
If the Calibration is not "perfect" all the Data generated will have little or no Value.
Operator
Again this may be also very obvious, but the Operatorr must have knowledge on how to properly Operate the Instrument.
If the Instrument is a gizmo with multitude of buttons and dials then definitely both knowledge and experience is required.
However, there have been hundreds of instances where the Operator = Vehicle
Owner, looked at "wrong" dipstick !
Like for example the ATF rather than the Motor Oil.
While that may sound "stupid", it is actually a common mistake, as OEM's do not seem to be in agreement on where to place a dipstick for Motor Oil, or what the design or color should be.
One vehicle may have RED dipstick handle for Motor Oil and YELLOW for Gear Oil, while another will have YELLOW for the Motor Oil and RED for ATF.
So even Automobile Service Technicians frequently make such "stupid" mistake !
Procedure
The Operator must follow specific Procedure so that the Instrument yields proper Data.
- Pull out Dipstick
- Wipe off Dipstick End = "Sample Preparation"
- Fully re-insert the Dipstick
- Pull out Dipstick
- Proceed with the Analysis
- Observe the Motor Oil Level
- Observe the Motor Oil Color
- Other "optional" steps, if desired
- Optionally Record the Data
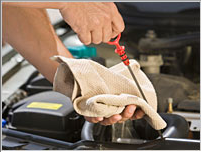
Sample Preparation
In this particular case the Sample Preparation is integral part of the above Procedure, that is "Wipe off the Dipstick"
It is nevertheless a very important step, or else the reading may be incorrect.
For example, if the engine was just shut-off and the Motor Oil did not have time to "run-off".
In case of vehicle that was parked overnight on a level ground, that step is not required, but it is still a good practice to get into a "habit" of doing it anyway.
Result
In this Analysis we get two results:
- Motor Oil Level
- Motor Oil Color
Result Interpretation
In any Analysis to be of any Value, there has to be an Interpretation, as the Consumer or Owner of the Vehicle, or the Fleet Manager, may not be expert on the particular "Raw Data".
In this case we compare the First Result to the Calibration on the Instrument, the HI and LO markings on the Dipstick itself.
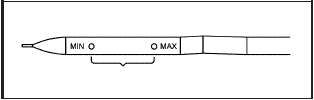
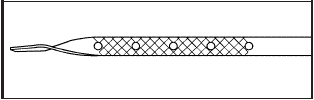
Just like OEM can not agree on what color or design to use for the Dipstick handle, they also can not after 100 years agree on the type and style of the Calibration makings.
Some have lines, some have holes, same have LO and HI, some have MIN and MAX, some have a shaded area, some have crosshatch, and some have combinations of several of these.
If you do not know what the calibration markings represent then consulting the proper "Owner Manual" is in order!
But generally, but not ALWAYS, the distance between the lower-most and upper-most marking represents either 1 Quart or 1 Liter of Motor Oil.
IMPORTANT !!!
On ATF or Gear Oil Dipsticks, the distance between the lower-most and upper-most marking may represent ONLY 1 Pint or 1/5 of Liter.
Consulting the "Owner Manual" for other than Motor Oil Dipsticks is a MUST !
Trend
Without a Trend any Result is just a Point in Time and Space that does not specifically relate to anything.
In case of a properly Calibrated Dipstick, you can at least establish if the current Motor Oil level is adequate, too low or too high.
But if you have absolutely NO information what the previous reading was in past mileage or time, you can not establish a Trend - that is reliably at least guess at the "future".
Let's say the Oil Level on the Dipstick is exactly 1/2 the
way between LO and HI.
More or less the equivalent of the "famous":
"Is the GLASS half FULL or HALF empty ?".
If you do know the PREVIOUS Motor Oil Level, and when in the PAST (miles driven, engine run time or calendar time) it was so, you can then make a Recommendation based on the PAST and PRESENT data, which has a good chance of being appropriate.
But if such information is not available, making "automatic" assumption that 1/2 Quart needs to be added, may not be proper !
What IF ?
The previous reading only 3,000 miles ago was
LO and now it
is HI !
That may indicate a serious problem, like other fluids leaking into the
Crankcase!
The same "false" assumption can be made about the Motor Oil "Color", if you do not know what color the Lube was when FRESH.
Some of the most common "false" assumptions are about the quality of SynLube™ Lube‑4‑Life® products, because they are OPAQUE BLACK when FRESH.
However, for Conventional Motor Oil being "Black" is generally a sign of a "problem".
SUMMARY
While a "Dipstick Used Oil Analysis" sounds simple, it still requires some
forethought as well as Operator skill and experience to get proper
Result.
Only if some previous Data is available, can Trend be
established and proper action can be taken based on the
Analysis.
In this case, if Motor Oil should or should not be added, based on the current Motor Oil Level.
ADVANCED Used Motor Oil Analysis
While the "Dipstick Method" is example of the BASIC Used Oil Analysis, the
more ADVANCED methods and procedures require special equipment, experience or
interpretation skills.
However they are still a low cost methods, that can be made on the spot by
vehicle owner or operator to get more information about the Used Motor Oil.
Yet strangely they are not used by Automotive Service Technicians !
Here are some examples of ADVANCED Used Oil Analysis
They are named either by the action or the equipment that is needed to
perform them.
They are arranged on order of "difficulty" from simplest to more sophisticated.
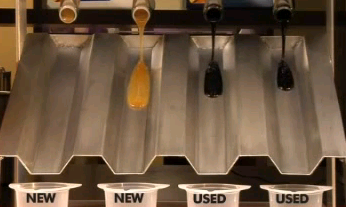
- Oil Drop Blotting
- Optical Microscope
- Hot Pan splatter
- Magnetic Attraction of Ferrometals
- Micro Filter Filtration
- Cold Flow
- Flash Point
Oil Drop Blotting
This simple Used Oil Analysis Test can be performed by anyone, however the interpretation of the Result requires both Knowledge of Rheology as well as long term experience to obtain any meaningful Data.
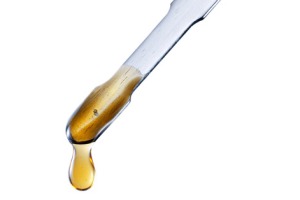
Oil Drop Blotting:
- Device
- Dipstick or Dropper
- Special Blotting Paper or Filter Paper
- Analysis Type
- Visual
- Condition Observed
- Blot Size
- Motor Oil Color
- Condition Observed
- Visual
While simple the Oil Drop Blotting Test actually has a poor repeatability, as it is rather difficult to "drop" exactly the same size Oil Drop every time.
In order to establish any Trend, the Test Result Samples have to be either stored safely or photographed in exactly the same way (light, exposure, lens settings, etc.)
The TEST PAPER, what ever it is has to be EXACTLY the same for all tests or the results can not be compared, this alone may be a problem for long term use, as the same TEST PAPER may not be available again in the future.
Finally the Result is personal Interpretation of the Analyst, based on previous experience as well as Trend, so a single point test alone can not yield any useful Data.
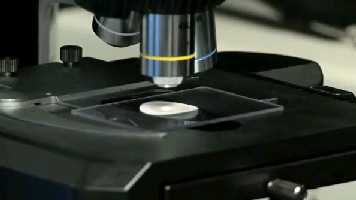
Optical Microscope
The advantage of this test is that also only one drop of the USED Oil is required, but it requires at least 100X power Microscope with proper illumination.
The Oil Drop can be either from above test, or placed on Slide
Once the Microscope is properly focused, the slide or paper can be moved slightly about to examine the content of the Oil Drop in detail.
Water, Air, Fuel can be seen as "bubbles".
Contaminants such as dust and foreign particles can be easily identified, as
Conventional Motor Oil, has nothing in it that is visible at up to 400X
magnification
Wear particles of various size and color can be seen, but to interpret what they are, requires long term past experience with Optical Microscope Used Oil Analysis
High strength Magnets can be used to identify ferromagnetic iron particles and distinguish them from aluminum, copper or brass
Knowing what to look for is the Key to proper Analysis, but in the end it is also dependent on the Analysts Interpretation of what was "seen".
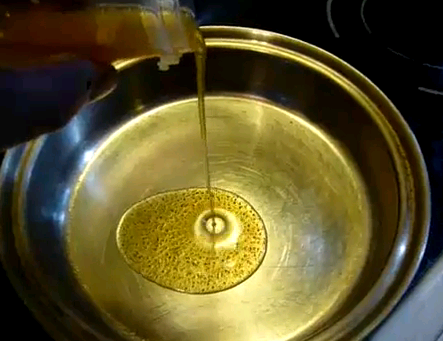
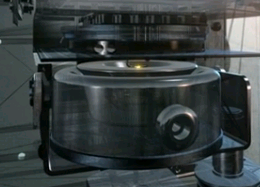
Hot Pan Splatter
This relatively simple test can be very dangerous if not performed safety, as it can result in sample ignition that can produce fire ball.
It is mostly used to determine in inexpensive way if water or fuel is present in the USED Oil Sample.
The pan is first pre-heated to specific test temperature, ranging from 212°F (100°C) to 500°F (260°C).
The USED Oil Sample is slowly poured on to the pre-heated pan and observed
Generally Oil without any contamination will just flow evenly about the pan.
While a contaminated Oil will bubble, crackle, smoke, ignite, or even explode!
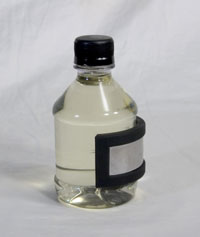
Magnetic Attraction of Ferrometals
A very simple test that only requires a very strong magnet.
I can be performed in unison with the Optical Microscope Analysis on just one Oil Drop or on a specific volume placed into a "shaker bottle".
If the "shaker bottle" is used then the magnet is just held next to it on the outside and the sample is shaken vigorously for few seconds.
The Sample Oil is then poured out, and the magnet removed
The the ferromagnetic particles captured from the Sample Oil can then be seen.
Micro Filter Filtration
Microfiltration is a membrane technical filtration process, which removes contaminants from a fluid (liquid & gas) by passage through a microporous membrane.
A typical microfiltration membrane pore size range is 0.1 to 10 micrometers (µm).
Microfiltration can use a pressurized system but it does not need to include pressure.
USED Oil Microfiltration can only be meaningful and can be used for
development of a Trend, if the Sample Volume that is filtered is EXACTLY the
same for each test.
The Filtration Media also must be IDENTIAL for each test, otherwise the Results
can not be compared.
The Test Temperature of the fluid also MUST be the same for all tests, and must be carefully selected for the given Pore Size and Lubricant Viscosity.
If the temperature is too low or the viscosity too high for a given Pore Size, the sample will just "sit" on top of the Microfilter element and will not flow through, rendering the test useless.
After the filtration is complete the accumulated residue can be Analyzed preferably under Optical Microscope.
Cold Flow
This is another rather simple test that does not require any specific skill from the Operator, but it requires a refrigeration equipment, capable of reaching the desired Test Temperature, which can be as low as -40°F (-40°C).
Then the Frozen Oil Sample is simply poured from the Test Tube and the time which it takes for it to "flow" onto pan or ramp is measured.
The shorter is the time interval, the better is the Motor Oil, and if there is such available fixture, more than one Oil Sample can be tested and compared at the same time.
Flash Point
This is the type of USED Oil Analysis Test where the borderline between SIMPLE, ADVANCED and LABORATORY tests blurs.
The test can be performed as simply as the #3 Hot Pan Splatter Test, and just elevating the temperature until the USED Oil Sample "flashes", or can be done on just few drops of Oil in a sophisticated computer controlled unit that costs thousands of dollars.
But in both cases the resulting Data is the same, the Temperature at which the Oil Sample "flashes" that is the vapors spontaneously ignite.
Needless to say that the Laboratory version is "safer" as it is generally performed automatically in fully enclosed equipment and on very small sample volume.
The do it yourself in a hot pan test can be potentially very dangerous if large volume of Oil is used and the ignition results in a fire ball!
So do not try this one at HOME, unless you already have intimate experience with putting out Oil Fires, based on your failed cooking experience.
LABORATORY Used Oil Analysis
These tests can only be performed on specialized equipment in a dedicated Laboratory that specializes in Oil Analysis. That is because the cost of the required equipment is well beyond the means of most individuals or companies.
Only very large fleets can currently afford such equipment to have it for in-house testing.
There are several different currently popular Laboratory Tests:
- ELEMENTAL ANALYSIS
- INDUCTIVELY COUPLED PLAZMA (ICP)
- ROTATING DISC SPECTROSCOPY (RDE)
- INFRARED ANALYSIS
- Fuel Soot
- Oxidation
- Nitration
- Water
- PHYSICAL ANALYSIS
- VISCOSITY
- WATER Presence
- FUEL Dilution
- SOOT
- GLYCOL (Coolant Presence)
- FERROGRAPHY
- Ferrous Density
- Direct Reading Ferrography (Photo Detected)
- Particle Quantifier (Magnetic Resonance)
- Ferrous Density
- CHEMICAL TESTS
- NEUTRALIZATION NUMBER
- Total Acid Number (TAN)
- Total Base Number (TBN)
- NEUTRALIZATION NUMBER
ELEMENTAL ANALYSIS
It is the most popular and most promoted form of Used Oil Analysis (UOA), yet very few people actually take time to understand what it is, what are the different techniques for Element Detection, and how various versions of the Test Equipment differ in function, operation as well as Results.
While there are hundreds of pages and thousands of posts about UOA on forums like NORIA and the "Bob the Oil Guy", the UOA "fanatics" completely lack the understanding of the process, advantages as well as limits of the Modern Spectrometers.
The UOA devotees and promoters "falsely" believe that the generated numbers on a computer printout are the ultimate gospel, and take them as the ultimate truth !
Having total "blind" faith in such UOA results, they are unwilling to even consider that those Results in isolation from any Trend have little or no Value, and are nothing more than just a bunch of randomly generated Numbers without indication how they "got there" and what they "really" mean.
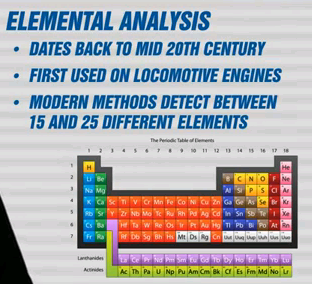
Elemental Analysis Limitations
Not all Elements can be reliably identified
This is the most misunderstood characteristics of the typical equipment that is used for UOA
The Sensitivity and Resolution of the relatively low cost equipment is not the same as the equipment that was used years ago and costed millions of dollars.
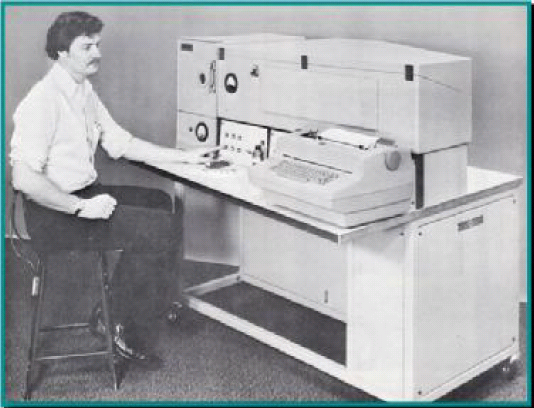
Baird FAS-2C spectrometer from the 1970�s, many of which were purchased by the U.S. military.
These were deployed at various military bases throughout the world and were also installed on aircraft carriers.
This was a rather large instrument with a one meter optic (the distance from the grating to the focal curve) and weighing about 800 lbs (364 kg).
Fast-Forward 40 years of development and this is how a current dedicated Oil Analysis unit looks and compares - it fits on any office desk !
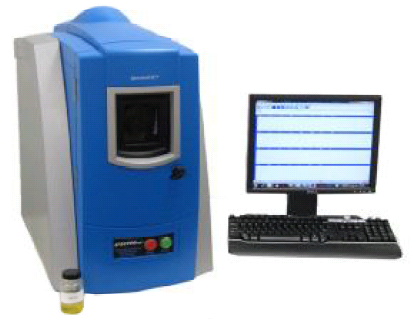
The Spectroil Q100, is Spectro's newest and completely solid-state spectrometer designed specifically for the analysis of oil samples. It measures trace quantities of elements dissolved or suspended as fine particles in mineral or synthetic petroleum based products using the rotating disc electrode (RDE) technique.
It interfaces with any PC which then can store and analyze the generated Data.
User friendly software enables simple operation with automatic recalibrating, while providing statistical functions for averaging and repeatability.
Resolution Limitations
To understand why there are limitations to which elements can be identified and the relatively large variance between repeat tests, one first needs to understand the basic Principles of Spectroscopy which, are in great detail described in another Page on our web.
On this page we will only illustrate this with two spectra pictured below:

Spectral lines are unique to the atomic structure of only one element. For the hydrogen atom, with only one proton (positive charge of 1) in the nucleus and one electron (negative 1), the spectrum is fairly simple.
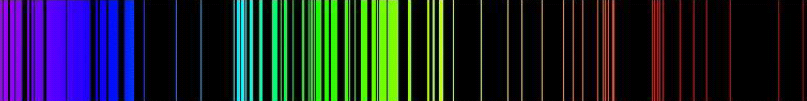
On the other hand, the spectrum of iron with atomic number 26 (the nucleus has a positive charge of 26) is much more complicated with many emission lines in the visible spectrum corresponding to the many possible electronic transitions that may occur.
Now consider this:
Typical Motor Oil even when FRESH is mixture of hundreds of different
hydrocarbon molecules, some of which are just Carbon and Hydrogen bonds, while
others incorporate other elements within them.
Then there are dozens if not hundreds of other intentionally added chemicals
(Additives) as well as other chemicals (Impurities).
Not only they all have their own specific spectral lines, as they are being "burned" during the Analysis in the equipment, they "oscillate" and cast "shadows" - so the actual Detection of the Individual Elements as well as their relative Concentration measured in Parts per Million (PPM) is extremely difficult task.
Other molecules may dis-associate their elemental atoms, while others may be
formed during the "burn".
Making the accurate and repeatable Detection a very difficult task.
Parts per Million - PPM
While you understand that million = 1,000,000,000.
It is not all that easy to visualize or understand how much ONE PPM relates to
the "whole".
However first of all we have to understand that the PPM can be counted differently !
One PPM by Volume, is NOT the same as One PPM by Weight !
When people Buy Motor Oil they buy it by Volume, that is US Quart, US Gallon or Liter.
So it is easy to understand that when they think of PPM in Oil Analysis Results they automatically think of "Volume" and not "Weight".
Elemental Analysis however is a MASS SPECTROGRAPHY - that is the "mass" or
"weight" is what is measured in the test sample, and not the "Volume".
Thus the results are in relative weights, and since every element has a
different "mass" the PPM numbers are not all that "straight forward" as it
"appears".
Here is a Visualization of how ONE PPM of Iron relates to the "Whole" - Volume of Oil.
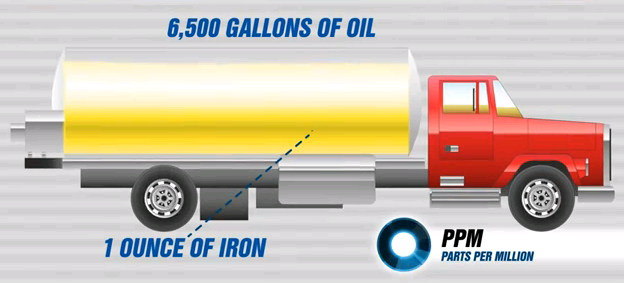
Important point to remember:
Selected metallic elements present in Oil Test Sample as micronic particles and suspended in the fluid to be analyzed are identified and measured in parts per million by weight.
Micron = Micrometer
Micron is the same as Micrometer, which is one-millionth of a meter (or one-thousandth of a millimeter, 0.001 mm, or about 0.000039 inches).
Or now that you know what PPM is, think of Micron as ONE PPM of a Meter.
However it is still difficult to imagine how "big" a Micron really is, especially since it is invisible to a naked eye !
Indeed you actually need a 400X Microscope to be able to make it "visible".
For easy comparison, the thickness of a Human Hair ranges from 40 to 120 Microns, and most hairs are in 80 to 100 Micron range.
Since we are discussing Motor Oil, it is important to realize that most Motor Oil Filters will not "filter-out" particles that are Smaller than 20 microns, and many low cost Oil Filters are only efficient in 40 to 60 Micron range and above.
This page is UNDER CONSTRUCTION...
![]()
.... Please check back in few days !!!
SynLube™Lube‑4‑Life®

CONCLUSION
Now that you understand the Ins and Outs of UOA, it will be easier for you to comprehend the advantages and benefits that SynLube™Lube‑4‑Life® offers.
To learn about them please see SynLube MAGIC section on our web site.